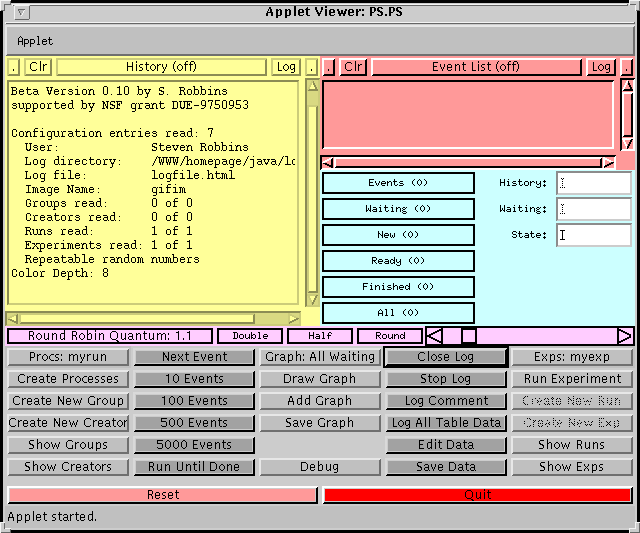
Figure 1: The main simulator window.
An experimental run consists of a scheduling algorithm and a collection of processes to be run under that algorithm. An experiment consists of a number of experimental runs which are to be compared and analyzed. The simulator organizes the input information in order to make it simple to do experiments in which one or more parameters is varied. After the experiment has completed, you can produce tables or graphs of various statistics such as average waiting time, and throughput.
To perform an experiment, you must create two files. One file contains (the run file) contains information about the parameters that are common to all of the runs. The other file (the experiment file) contains a list of runs to be made and the parameters that vary between runs.
Information about the experiment including the specification of the processes and the statistics and graphs resulting from the experiment is stored in a log file in HTML format suitable for viewing from a browser.
This document describes how to use the simplest features of the process scheduling simulator locally on the system at UTSA. The simulator is not ready to be used remotely at other locations because of the problems with standardization of methods to bypass the Java sandbox security. This situation should improve when browsers support Java 1.2.
The simulator is of beta quality, and this documentation is of alpha quality. As the simulator is still being revised and the user interface has not been fixed, this documentation may be inaccurate in some of its details. General information about an earlier version of the process scheduler can be found here.
The yellow subwindow in the upper left corner labeled History shows the initial configuration read in from the configuration files. There are five columns of buttons at the bottom of the main window. The rightmost column of buttons allows you to choose the experiment to run and to run it. Pushing the top button in this column advances through the available experiments. Pushing the second button, Run Experiment, runs the chosen experiment.
The fourth column of buttons controls the log file. The top button allows you to open the log file. When the log file is opened, the button is changed to a Close Log button as shown in the diagram above. As runs are made they are logged in the log file and statistics about the run are saved. Pushing the Log All Table Data button puts two tables of statistics in the log file. The tables contains entries for all selected runs. All runs are selected by default. A sample set of tables is shown in Figure 2.
The first table contains information about average CPU utilization, throughput, turnaround time, and waiting time for each run. The second table contains more detailed information about the turnaround time and waiting time. In addition to the average, the minimum, maximum, and standard deviation are given for each.
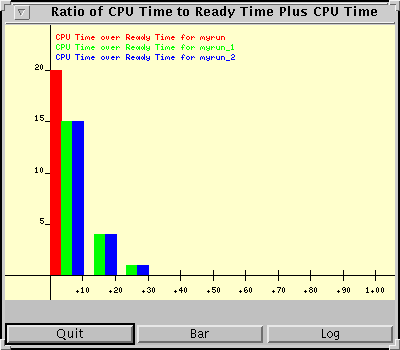
The third column of buttons controls the creation of graphs. The top button allows you to choose the type to graph to create. The entry Graph: All Waiting means that a graph containing information on the waiting time for the processes of each run is to be produced. Each run is in a different color, and the distribution of waiting times is shown as a bar graph. The quantity graphed is the ratio of the CPU time to the total time in the ready queue plus the CPU time. Pushing the Draw Graph pops up a window containing the graph. This window contains a Log button that causes the graph to be inserted in the log file. A sample graph is shown in Figure 3.
The first two columns of buttons give you finer control over the running of the simulator and are described later.

Figure 1: The main simulator window.
| Description | Algorithm | Time | Processes | Finished | CPU Utilization | Throughput | Turnaround Time | Waiting Time | myrun | SJF | 14054.11 | 20 | 20 | .99993 | .001423 | 12207.23 | 11491.02 | myrun_1 | SJF | 14055.11 | 20 | 20 | .99986 | .001423 | 9736.38 | 9019.53 | myrun_2 | SJF | 14062.11 | 20 | 20 | .99936 | .001422 | 9615.53 | 8897.77 |
| Turnaround Time | Waiting Time | ||||||||
| Description | Algorithm | Average | Minimum | Maximum | SD | Average | Minimum | Maximum | SD | myrun | SJF | 12207.23 | 9616.72 | 14054.11 | 1422.47 | 11491.02 | 9090.00 | 13068.65 | 65.13 | myrun_1 | SJF | 9736.38 | 3053.16 | 14055.11 | 3348.57 | 9019.53 | 2439.31 | 13472.67 | 167.67 | myrun_2 | SJF | 9615.53 | 2486.45 | 14062.11 | 3550.87 | 8897.77 | 1867.60 | 13347.37 | 177.02 |
Figure 2: Two tables of data created by the simulator when the Log All Table Data button is pushed.

Figure 3: A graph created by the simulator when the Graph: All Waiting is selected and the Draw Graph button is pushed.
Copy all of the files from /usr/local/courses/java/psfiles into this directory. Edit the file psconfig so that the logdir line points to a directory that you have write access to and is accessible by a browser. Use a complete absolute path name. Edit the user line to include your full name. You must be logged onto a machine on the network using an X environment. Make sure that /usr/local/courses/java/bin is in your path and execute runps.
The following distributions are supported:
name experimental_run_name
comment "experimental_run_description"
algorithm algorithm_description
numprocs number_of_processes
firstarrival first_arrival_time
interarrival interarrival_distribution
duration duration_distribution
cpuburst cpu_burst_distribution
ioburst io_burst_distribution
basepriority base_priority
Here is a sample experimental run file that must be stored in the file myrun.run.
name myrun
comment "This is a sample experimental run file"
algorithm SJF
numprocs 20
firstarrival 0.0
interarrival constant 0.0
duration uniform 500.0 1000.0
cpuburst constant 50.0
ioburst constant 1.0
basepriority 1.0
This file specifies a run of 20 processes using the shortest job first algorithm. The first process arrives at time 0.0. The interarrival times are all 0.0, so all processes arrive at the same time. Each process has a duration (total CPu time) chosen from a uniform distribution on the interval from 500 to 1000. All processes have a constant cpu burst time of 50 and a small constant I/O burst time of 1.0. The base priority must be present in the file, but it is currently not used.
In the simplest case, an experimental run can be specified by the name of the run. In may cases, you will want to make several experimental runs in which almost everything is the same, except that one or more parameters are changed. For example, you might want to vary the quantum used for the round robin scheduling algorithm but use the same set of processes.
The simulator allows you to do this by specifying the same experimental run in each case and giving a new value to one or more parameters. The general format for a run line in the experiment file consists of the word run followed by the name of an experimental run, followed by a list of modifications to that experimental run.
The experiment file format is as follows:
name experiment_name
comment "experiment_description"
run run_name1 optional_modification_list1
...
run run_namen optional_modification_listn
Here is an example experiment file that must be stored in the file myexp.exp
name myexp
comment "This experiment contains 3 runs"
run myrun
run myrun cpuburst uniform 10 90
run myrun cpuburst exponential 50
This experiment file makes three runs. All of the runs are based on the run file myrun.run above. In the second run the CPU burst distribution is changed to be uniform in the interval from 10 to 90. In the third run the CPU burst is an exponential distribution with mean 50.
Only the simplest case is described here in which the modification applies to all processes in the run.
A modification specification is a string of tokens separated by one of a small number of key words indicating which parameter is to be modified. The key word is followed by parameters specific to the value to be modified. For example, if the value to be modified is a distribution, then a distribution is specified in the format described under Probability Distributions.
Here is a list of the key words and the appropriate parameters:
At this time the supported key words are:
logdir /home/myname/public_html/pslogs
logfn logfile.html
imagename gifim
user Steven Robbins
portable true
run myrun
exp myexp
When the log file is opened, the simulator logs information about all of the available experimental runs and experiments. Here is what might be produced for the above configuration.
| Group Information for 1 Group | |||||
| Name | Commentary | Duration | CPU Burst | I/O Burst | Priority | myrun | Group from run myrun | uniform 500.00 1000.00 | constant 50.00 | constant 1.00 | 1.00 |
| Creator Information For 1 Creator | |||||
| Name | Commentary | Group | Processes | First Arrival | Interarrival |
| myrun | Creator from run myrun | myrun | 20 | 0 | constant 0.00 |
| Experimental Run Information for 1 Run | |||
| Name | Commentary | Creator | Algorithm | myrun | This is a sample experimental run file | myrun | SJF |
| Experimental Runs For 1 Experiment | |||
| Experiment | Commentary | Run | Modifications |
| myexp | This experiment contains 3 runs | myrun | |
| myrun_1 | cpuburst uniform 10.00 90.00 | ||
| myrun_2 | cpuburst exponential 50.00 | ||
The second table describes the number of processes and their arrival times.
The third table describes the scheduling algorithm to use.
The fourth table is a list of runs corresponding to the one experiment, myexp. Three runs are done each using the base run file myrun. The modified runs are labeled myrun_1 and myrun_2 and the modifications are shown.
The leftmost text area is labeled History. When active, it displays various information about the progress of the simulation. It also shows the results of any of the information buttons, some of which are located just below the other text area.
The rightmost text area is labeled Event List. When it is active it shows events are they occur.
Below the Event Log are 6 buttons which display information about processes and events.
To the right of these buttons are three text fields in which the process ID of a process can be entered. When a value is entered, information about that process is displayed in the History text area.
Below the scheduling algorithm are various buttons grouped in 5 columns.
The first two columns of buttons give the user finer control of the simulator than previously discussed.
The first column contains buttons related to creating processes with finer control than described in the section on experimental runs. It will not be described here.
The second column of buttons is for running the simulator. Normally these will not be used. Instead, an experiment will be run using the Run Experiment button.
Below the buttons are two narrow progress bars showing the progress of the simulation. The first is red and shows the fraction of total CPU time that has been used so far. When the red bar reaches the end, all processes are complete. The second progress bar is blue and shows the fraction of processes that have completed.
Finally, at the bottom of the window are two buttons.
There are times in which you run an experiment and want to run it again to look at it in more detail. The option portable true allows you to do this. The simulator uses a portable pseudo-random number generator with a fixed seed so that if the same run is repeated, it should produce exactly the same results. The seed is reset at the start of each run, so that a run is not affected by previous runs.
The option randomize n in the modification list allows the same run to be done with different values of the seed. It causes the random number generator to be called n times after it is initialized. If the same run is repeated with a different randomize value, it can produce different results.
Pushing this button brings up a window containing one line for each run that has been finished. Each line contains the name of a run and two buttons. Pushing the Log button changes it to NoLog and indicates that the corresponding run should not be included. Pushing the same button again resets it. The other button is marked Show. When it is pushed the line disappears from the data editor window. You can show the missing lines by pushing the Show Some button which changes it to Show All. Pushing it again resets it. When finished, you can push the Done button.
You will soon be able to run the simulator with logging by using the URL /java/pstest/jar2/PS.html and setting up your system to allow file I/O privileges to this Java code. Currently this requires JDK1.2 and has been tested with JDK1.2beta2.
It is not recommended that you do this at this time due to the security problems involved. These problems will be reduced as the security (breaking) features of Java are standardized.
Once your system is properly set up, you can run the simulator
by executing
appletviewer /java/pstest/jar2/PS.html
Instructions for setting up your machine to allow this will be available here shortly.
Eventually, you will be able to do this through a standard browser.